Crafting a Question
Let’s run through an example on how to craft a question!
First, navigate to the C360 BI tab in the Queries module and select New and Question.

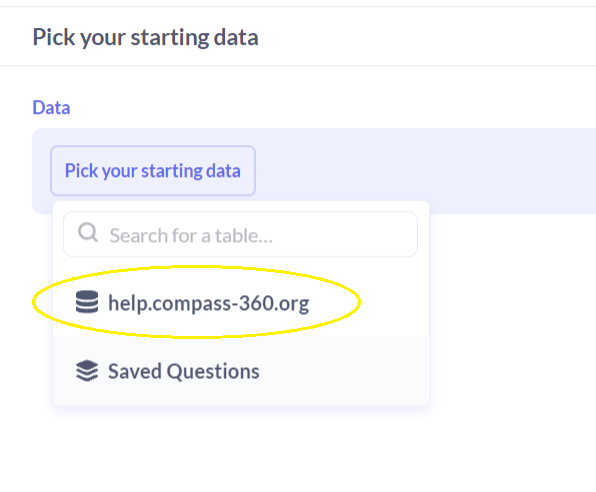
Select your Starting Data, which will be your organizational ID.
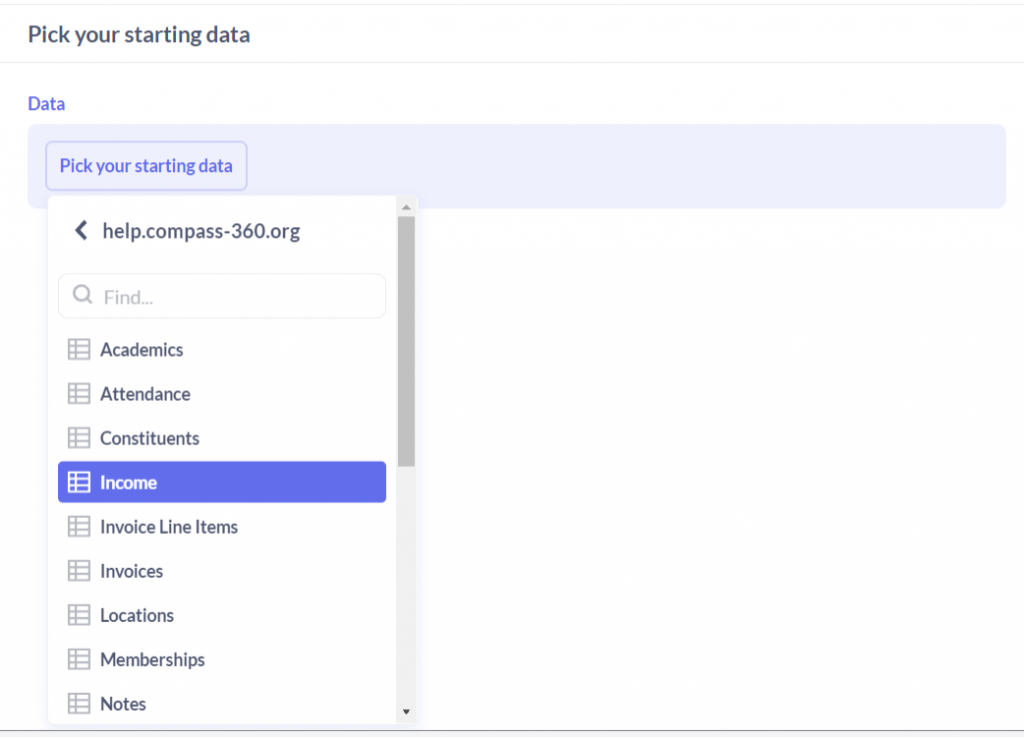
And then pick the data field you would like to work with – In this case, we will be selecting Income.
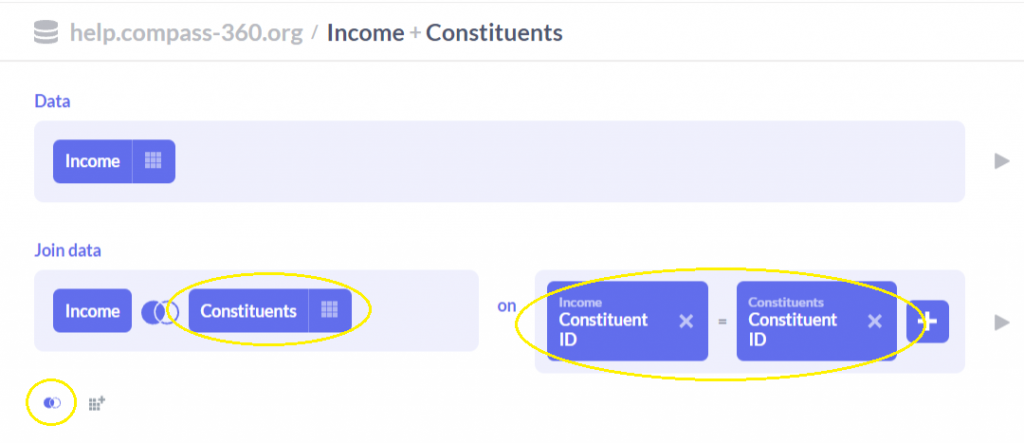
Because we would like to see data points about the constituents who have income tied to them, we will join data with Constituents. Constituent and Income data will be automatically linked by Constituent ID.
Now we can begin to filter our data to narrow down our results to what we are specifically looking for!
In this case, we can filter by Received On, where we can select a pre-set date filter as well as setting our own custom range.

And finally, we can Summarize on the Sum of Total Amount, but Grouped by Constituent Display names.
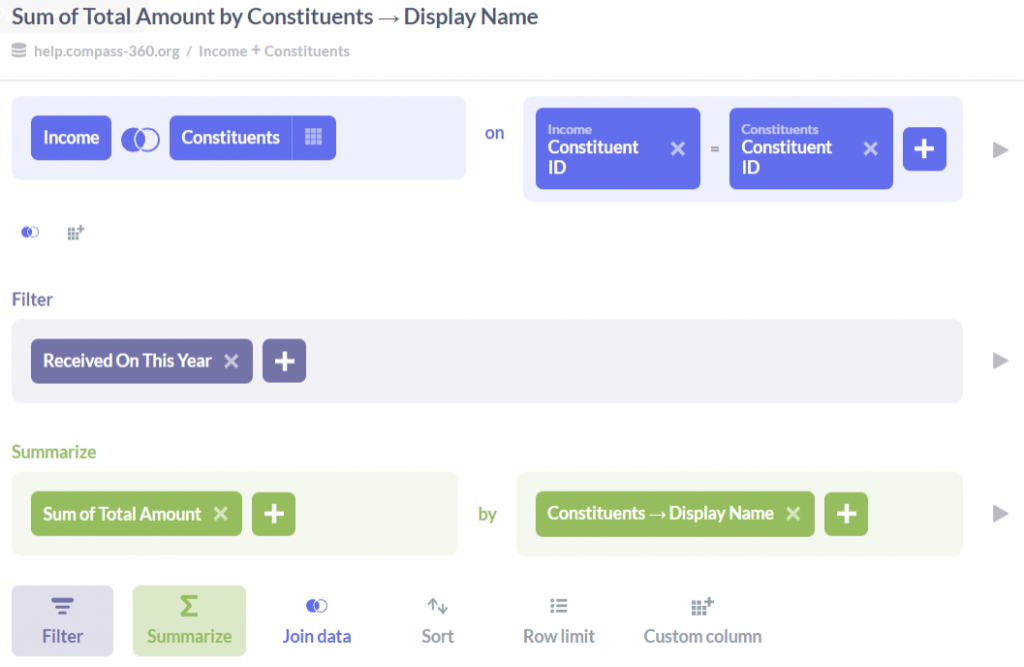
Selecting Visualize will now give us the total amount given, year to date, for each constituent.
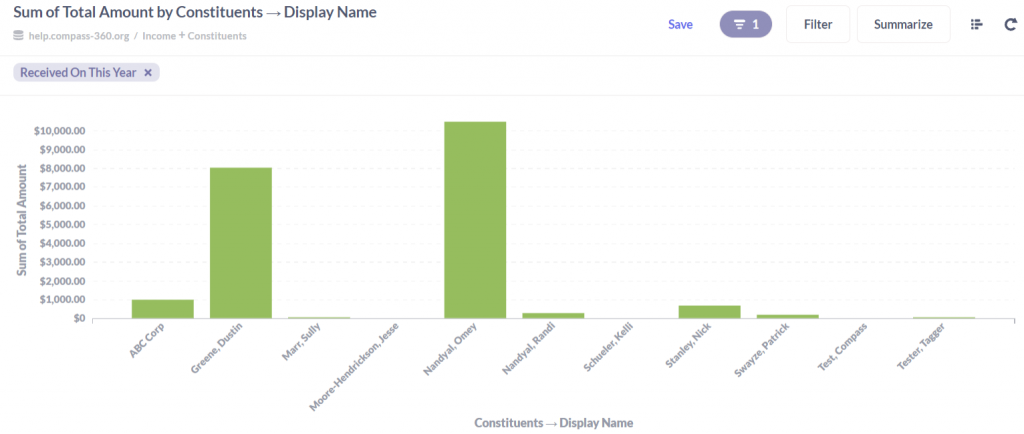
By selecting the Visualization button at the bottom-left of our window, we can change the way that this information is displayed to us.
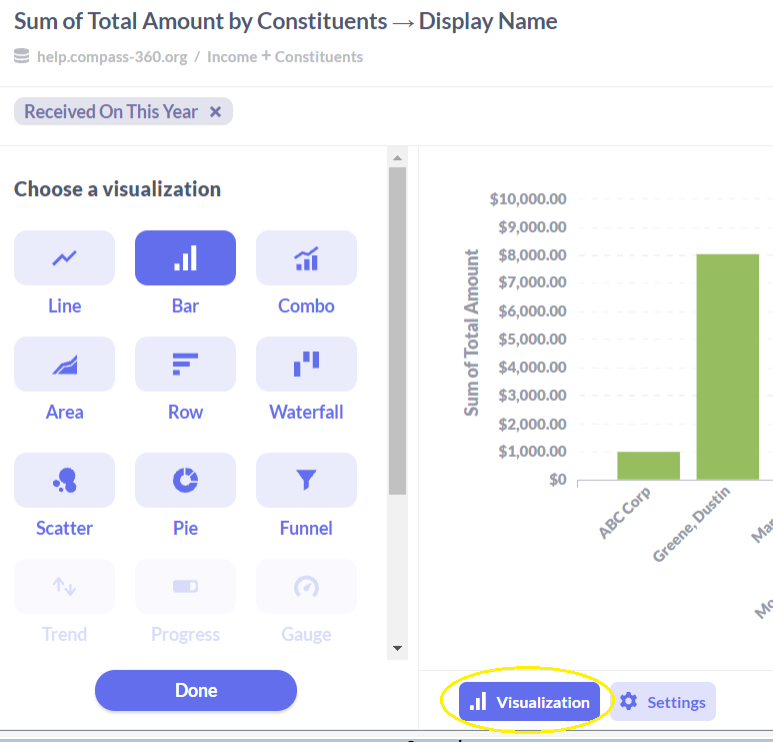
There are many options for how you can view your data, but for this case, I will select Table, which gives us a traditional spreadsheet with data points.

From here, a question can be exported or saved for review at a later date or to add as a Dashboard.