Dashboards
Dashboards are the presentation of our questions. They allow us to group questions and display them visually, in tables, graphs, charts and more. Dashboards can be private to a specific user, a set of users, or publicly shareable – such as a donor or grant research. They can also be embeddable into a website.
Dashboards are great when you have a set of answers that you want to view together. Your saved questions will be displayed as cards on the dashboard, which you can resize and move around to your heart’s content.
Core Dashboards
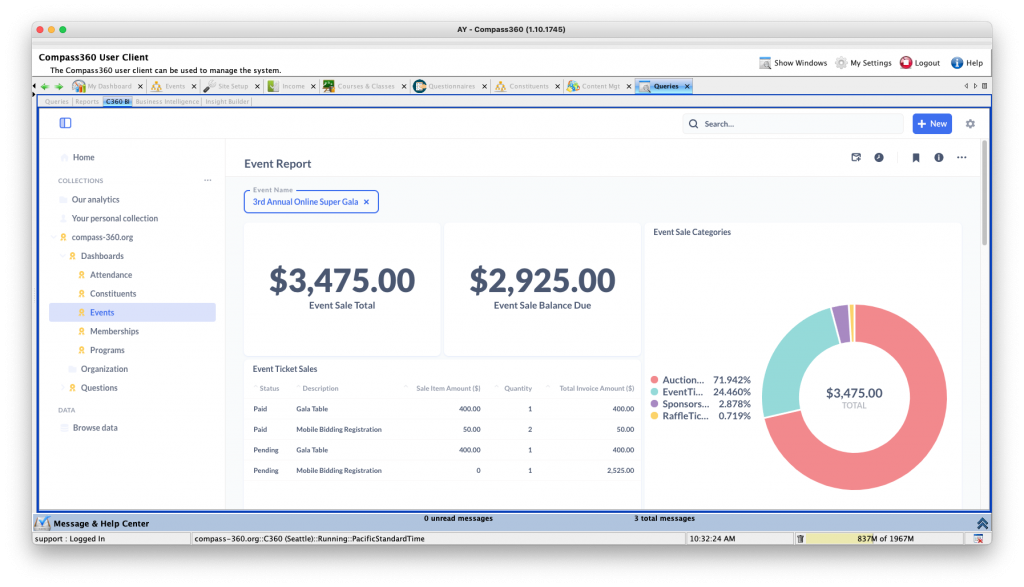
The Compass-360 team has created a base set of core dashboards for you to use. You can access these from the dashboard collection we have created for you.
You wont be able to modify these dashboards, at this time, but you can always create your own dashboards and add the same questions.
Navigating a Dashboard
A layout of a dashboard consists of cards of questions. You can resize these cards to better display large graphs or charts.
Editing a Dashboard
Click on the pencil icon in the top right to edit a dashboard. If you don’t see a pencil icon, that means you do not have permissions to modify it.
Once you click edit, the dashboard layout will change allowing you to resize a card or reposition one.
Add a Question to Your Dashboard
Once you click on edit, a new set of icons in the top right of the dashboard appear. Click on the 
Navigate the collections to find the question you are looking for. Alternatively, use the search to find the question.
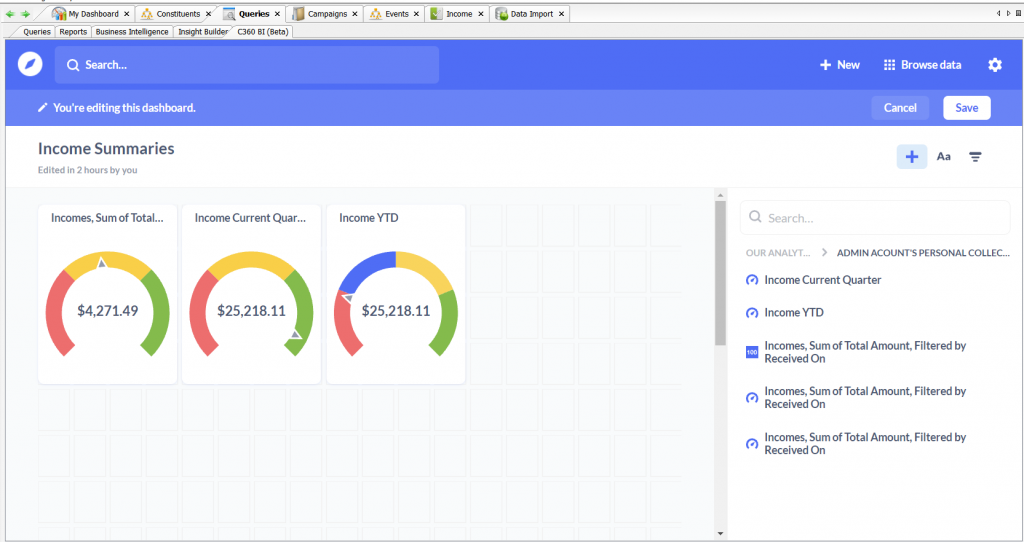
Once you select a question, reposition or resize it to your liking and click save.
Linking a Question
You can link questions to other questions or dashboards. This lets you click on a question and navigate somewhere else. To do this, click on the pencil icon to edit the dashboard.
Once in the editing mode, hover a question and click on the Click Behavior icon.
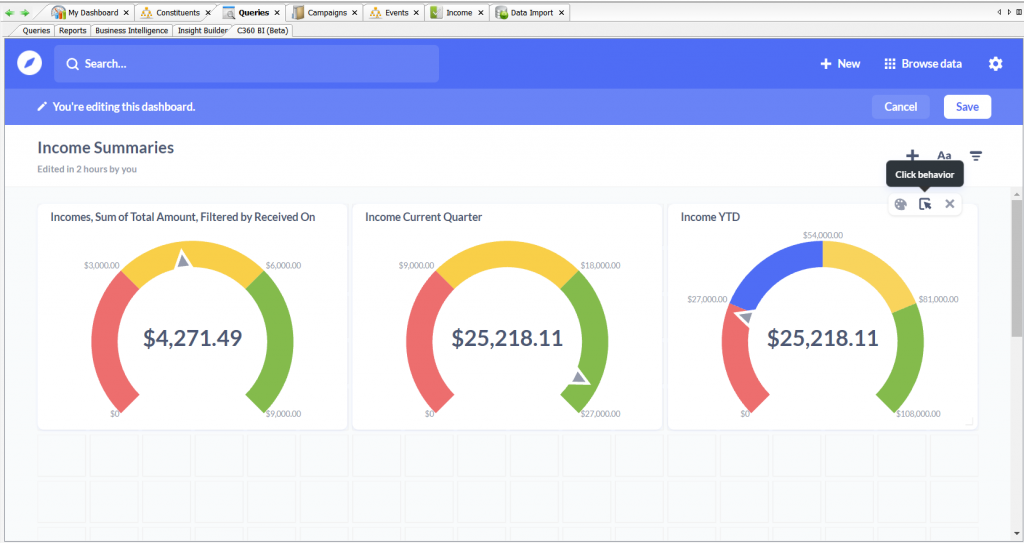
A sidebar will open which you can select the behavior when this card is clicked. For example, select navigate to another dashboard, select the dashboard you want and click save. Now when this card is clicked, that dashboard will show.
Sharing Dashboards
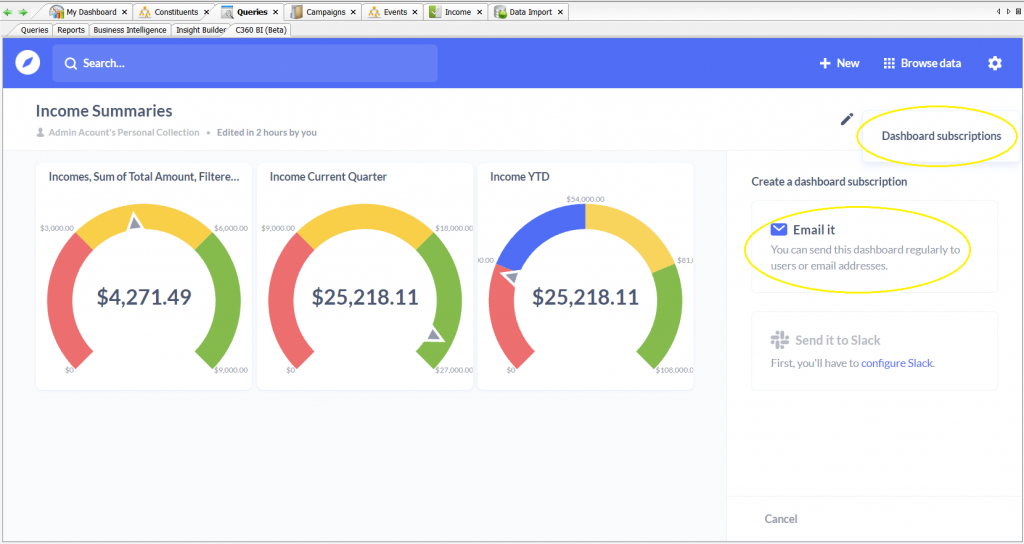
You can share dashboards via email to users inside or out of your organization. Click on the sharing icon from a dashboard to open the sharing settings.
Adding A Filter
You can add filters to dashboards that can change the filtering parameters on the displayed questions.
When editing a dashboard, click the filter icon. Select the appropriate filter type.
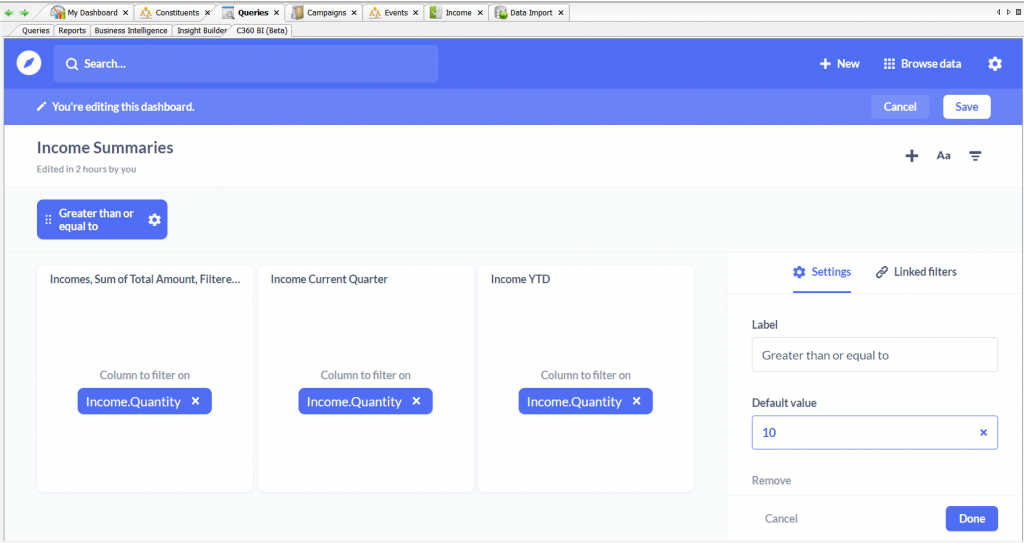
Once a filter has been added, you can set the default value. Next, we’ll want to select the data that when applied, this filter will update the cards displayed on this dashboard.
For each question, select the data you want to filter when a filter is active. For example, for the Number Greater Than or Equal to filter, we select the Income Quantity column in every one of the questions.
